Platform Background
- 21 Mar 2024
- 4 Minutes to read
- Print
- DarkLight
- PDF
Platform Background
- Updated on 21 Mar 2024
- 4 Minutes to read
- Print
- DarkLight
- PDF
Article Summary
Share feedback
Thanks for sharing your feedback!
In the demo environment we have setup, for the integration use cases we have implemented a solution with seperation between those resources which are the "iPaaS platform" and those which are an integration app.
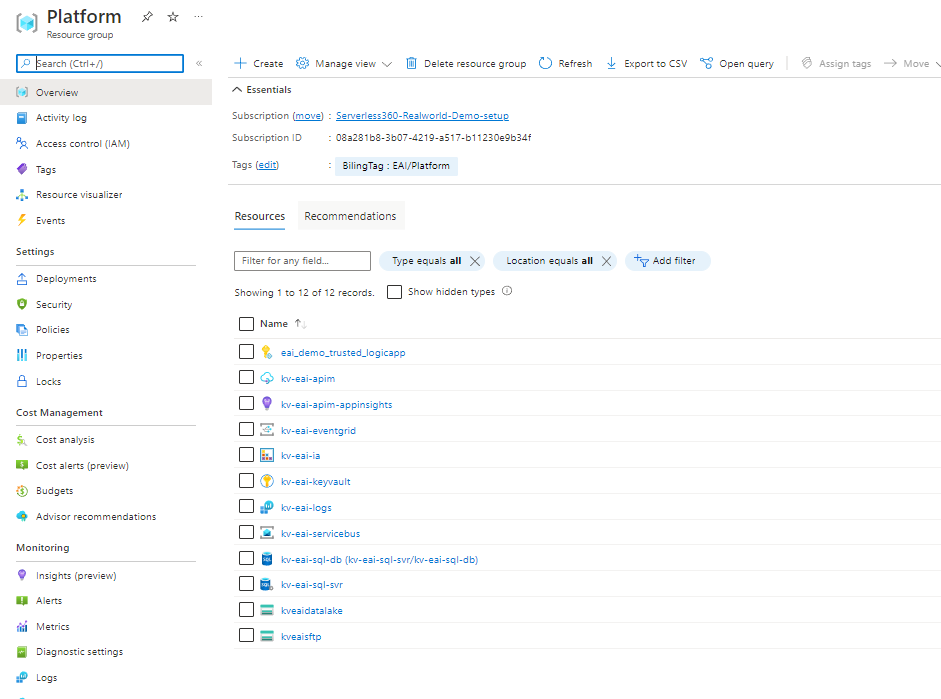
The platform resources are those which are shared across a number of integration apps, resource such as :
- Service Bus
- API Management
- Integration Account
- Hosting such as app service
In the below picture you can see the resource group.
When it comes to managing the platform we use a business application group in Turbo360 to manage the areas which are common across all solutions.
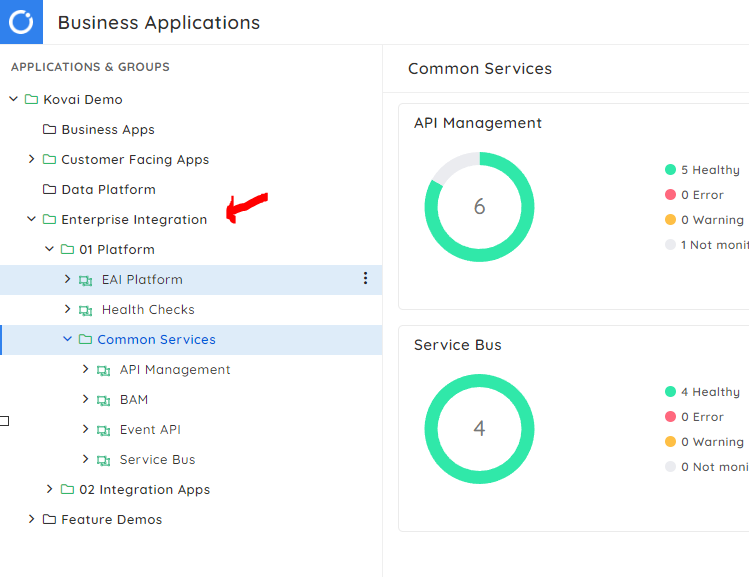
In the picture above you can see we have an area for the Enterprise Integration team and we have a platform area. Inside there we have business apps for the following areas.:
- EAI Platform is the common resources
- Health Checks are an area we have implemented some tests that our platform is running well
We also have a common services node on the tree where we put some Business Apps so we can have additional management of certain areas.
The following sections will take a look at some of the business apps
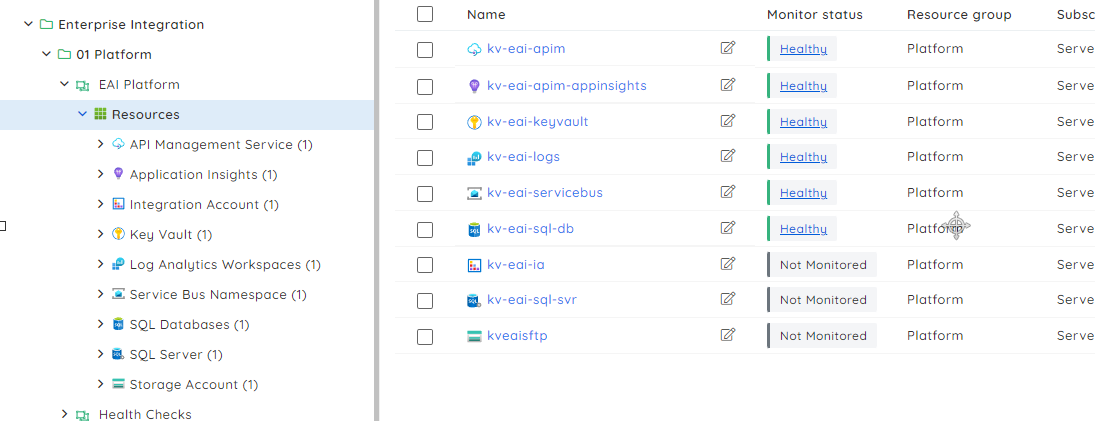
EAI Platform
In the EAI Platform you can see below I have added some of the key resources which are shared across my platform. They also have monitoring configured for each resource so you can easily see what is monitored and its health status.
I can use the service map to have a context diagram of my platform. The idea here is to make it easy for the support user to understand what each kind of resource does and a context diagram like below can help. The resource monitoring status is also indicated in the diagram.
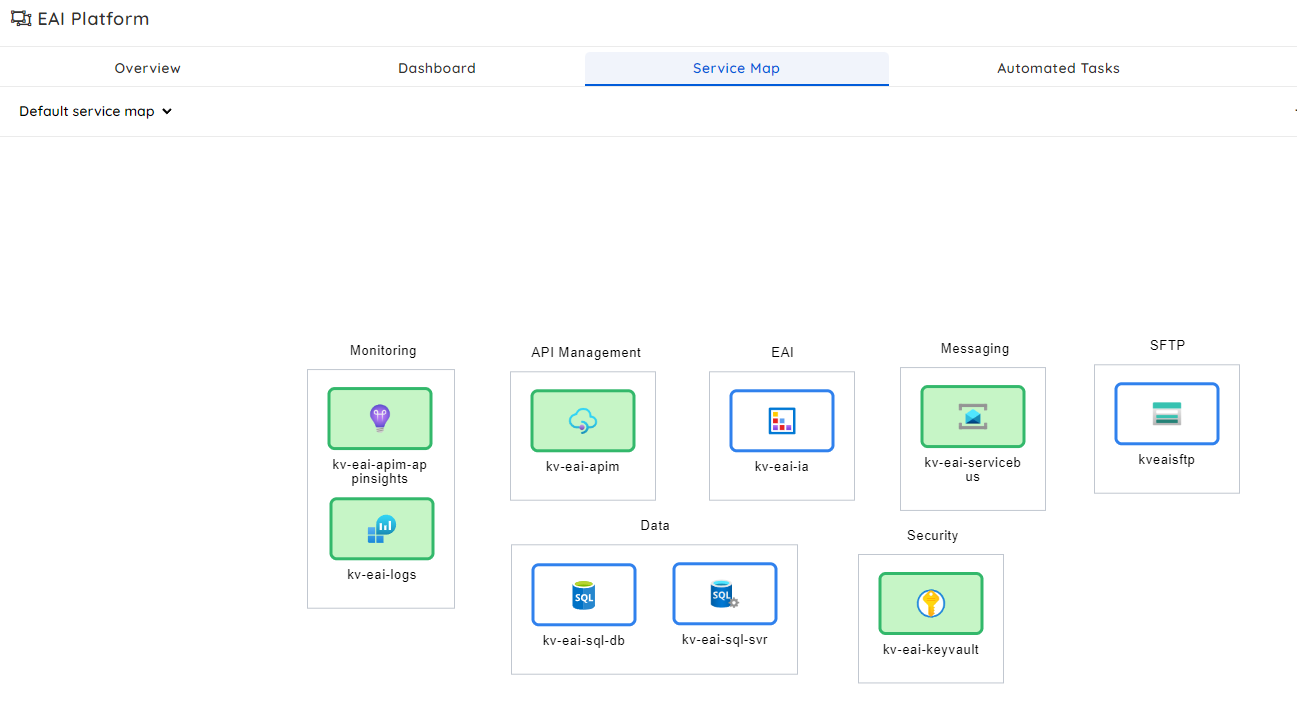
I can also use the dashboards to create easy to visualize views to see how my platform is running.
Health Checks
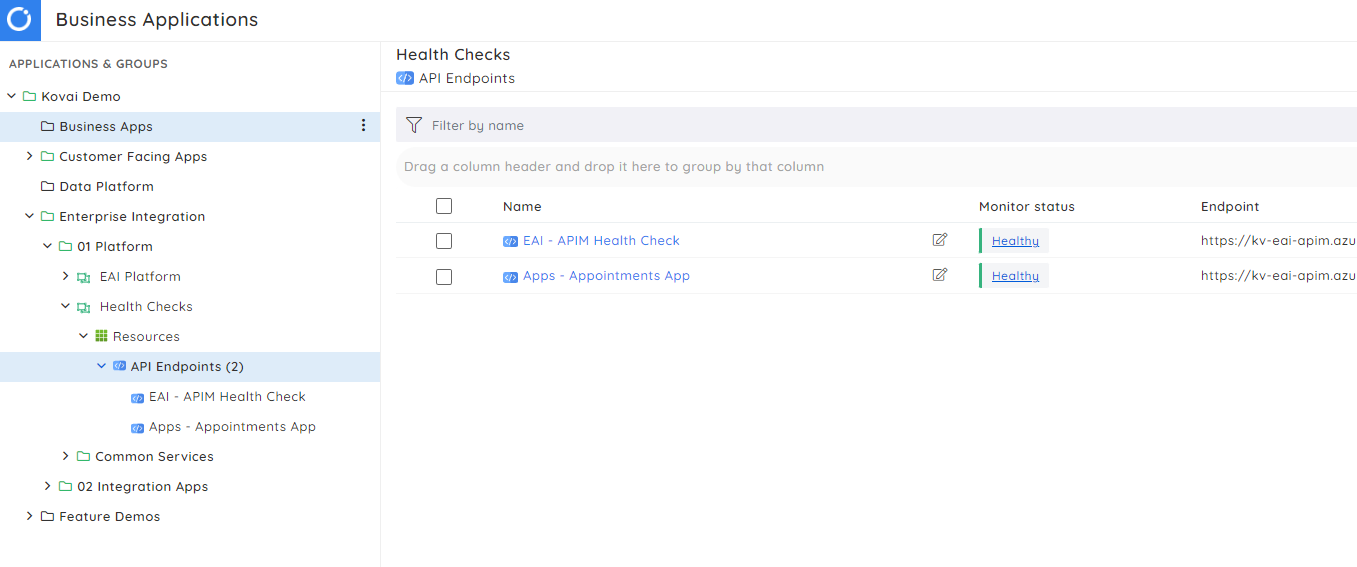
In the health checks app I would normally use the API Endpoint monitoring capability in Serverless 360 to be able to create a ping type test which will check that services in my platform are working.
You can see below that I have 2 tests setup which are showing healthy. This indicates some of my platforms key services are fine and that any dependencies the platform has are ok too.
Some examples of tests you might add include:
- Ping the APIM Health Status
- Ping a function app
- Ping a Logic App which runs a test to check a key system is online
- Ping a web page
This is quite an effective way to check if things are working well and to alert if something might be wrong which could cause problems for your integrations.
# API Management
In the APIM business app I will let a support operator focus on the general support of API Management. I will add the APIM service and each API as shown below.
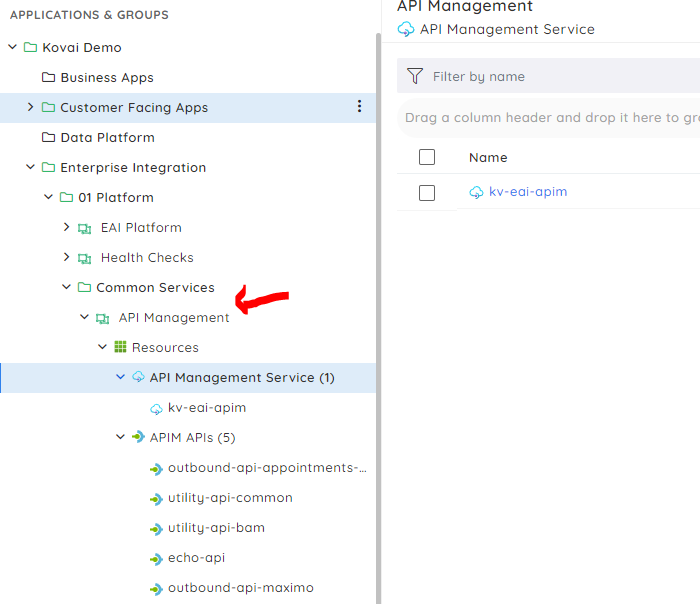
In this app we are looking at the holistic management and monitoring of the API's. I probably wouldnt add individual API operations or APIM Products here. Id tend to add those inside the business app which manages the solution where they are used. You will see examples of this in some of the Real world demos.
For each API that you add to the business app you get a dashboard for that API
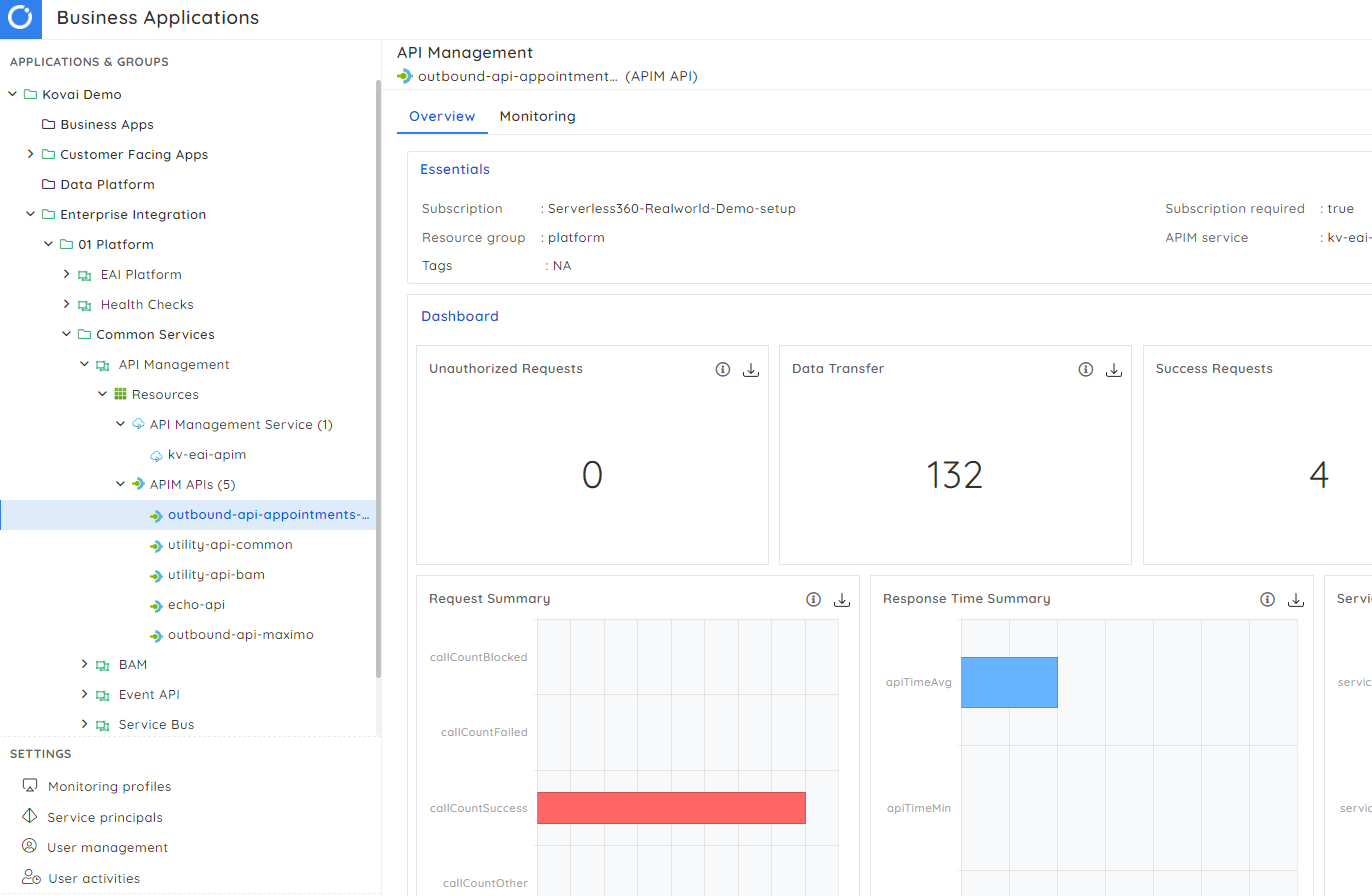
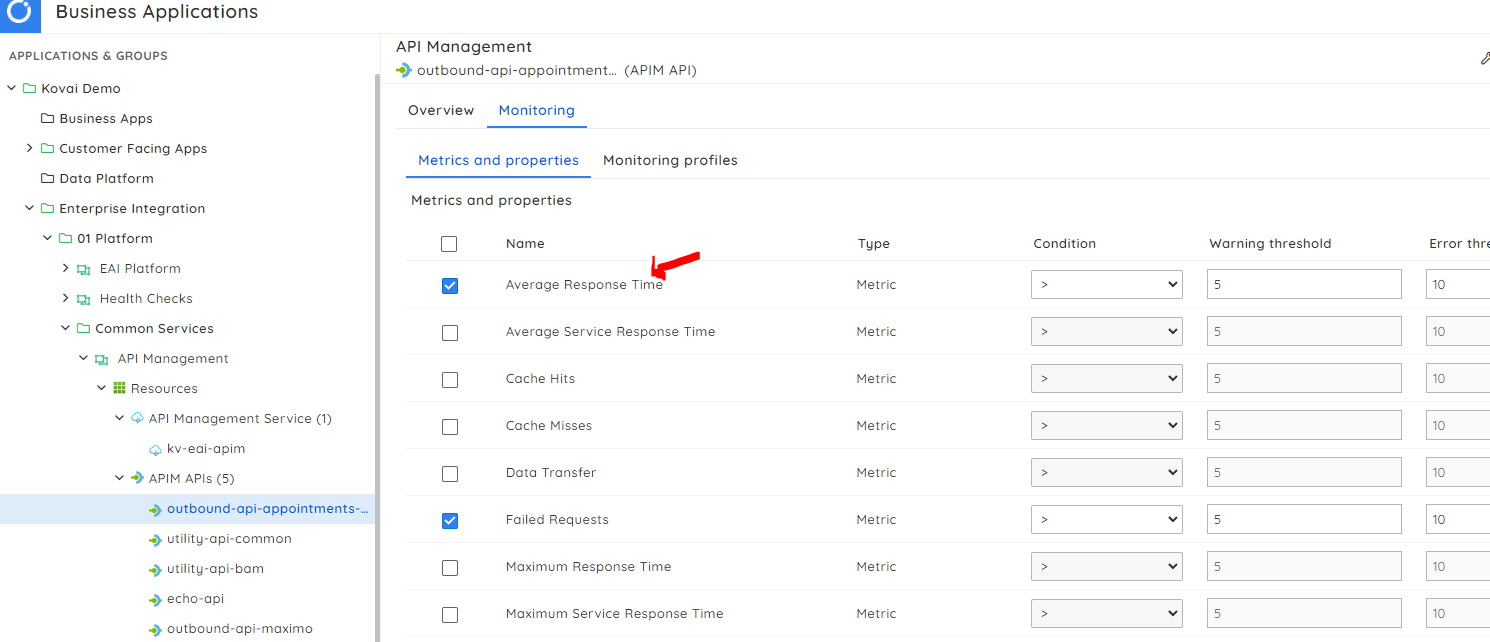
You can also configure monitoring for metrics specific to that API such as the response time or failures.
At the platform level Im looking to get confidence that my API's are generally performing well.
You can also add an Application Insights instance to the business app and do deeper dive analysis on your API which is discussed in more detail on the below link.
https://www.serverless360.com/blog/application-insights-health-check-with-serverless360
Service Bus
In my platform area I also like to have a common business App where I add all of my service bus entities. Again I can also add them to the business app which manages the solution each queue is used in but I also like this central business app where I can see all queues in one place.
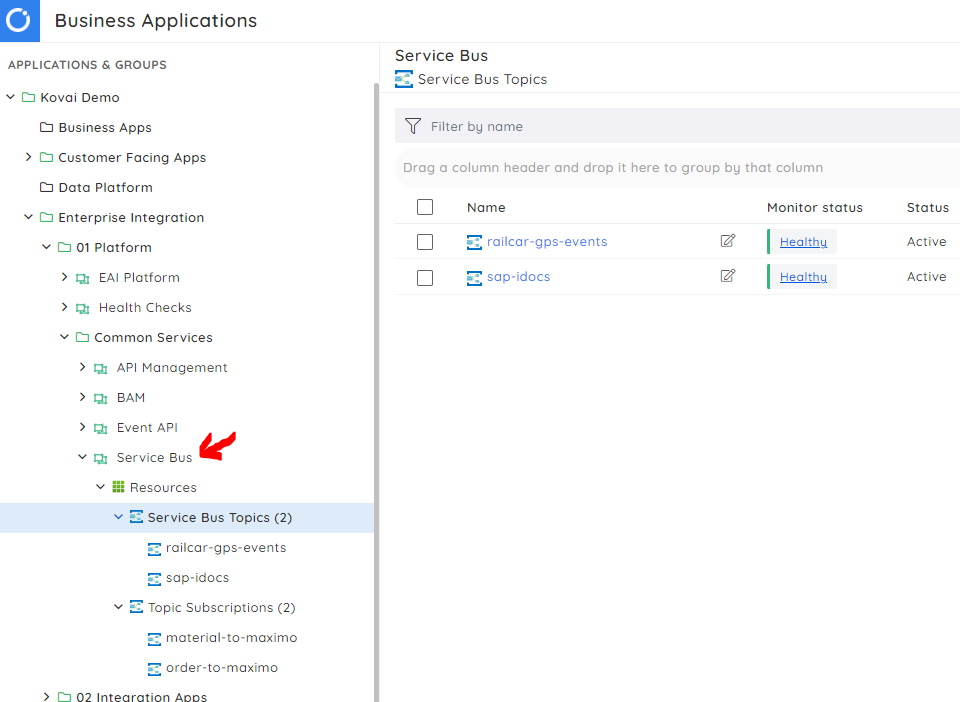
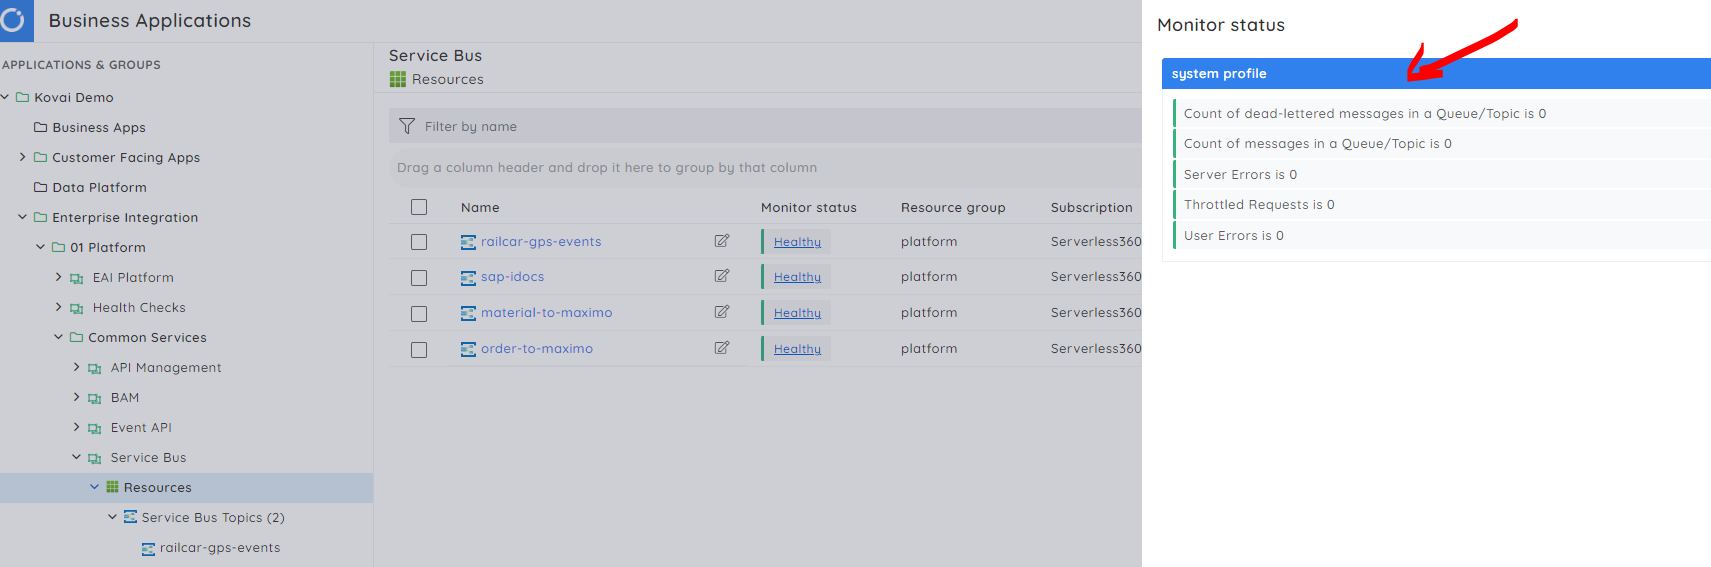
For each service bus entity you can have monitoring from either a profile which allows you to easily setup standard monitoring for lots of entities or custom monitoring for a specific queue. This lets you see below how easy it is to see the state of your queue
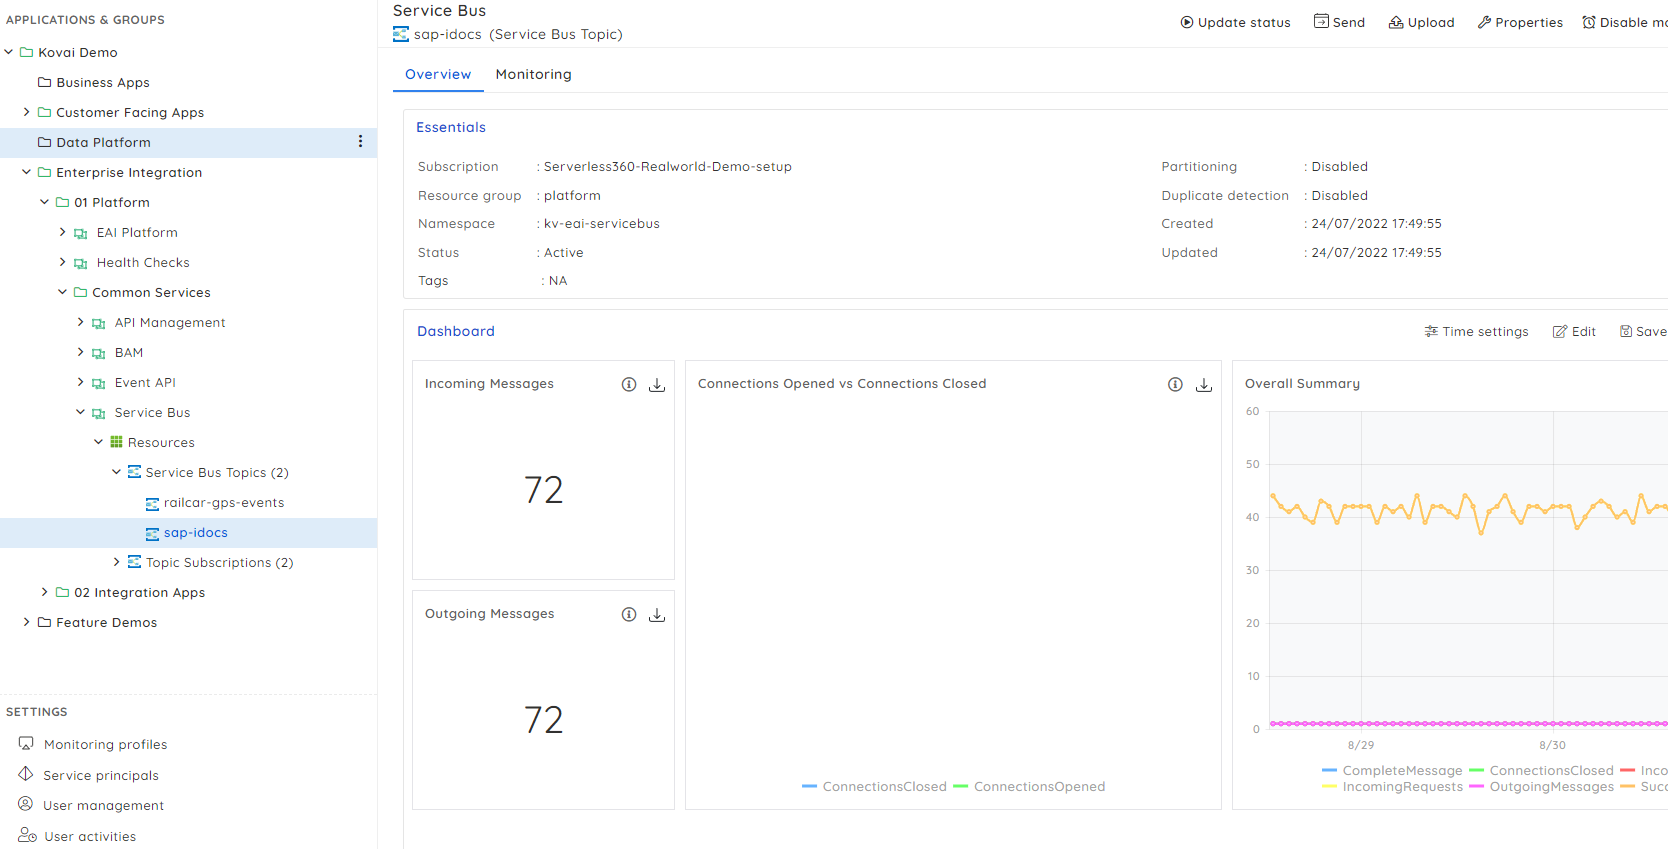
I will get dashboards for each service bus entity showing how they are performing.
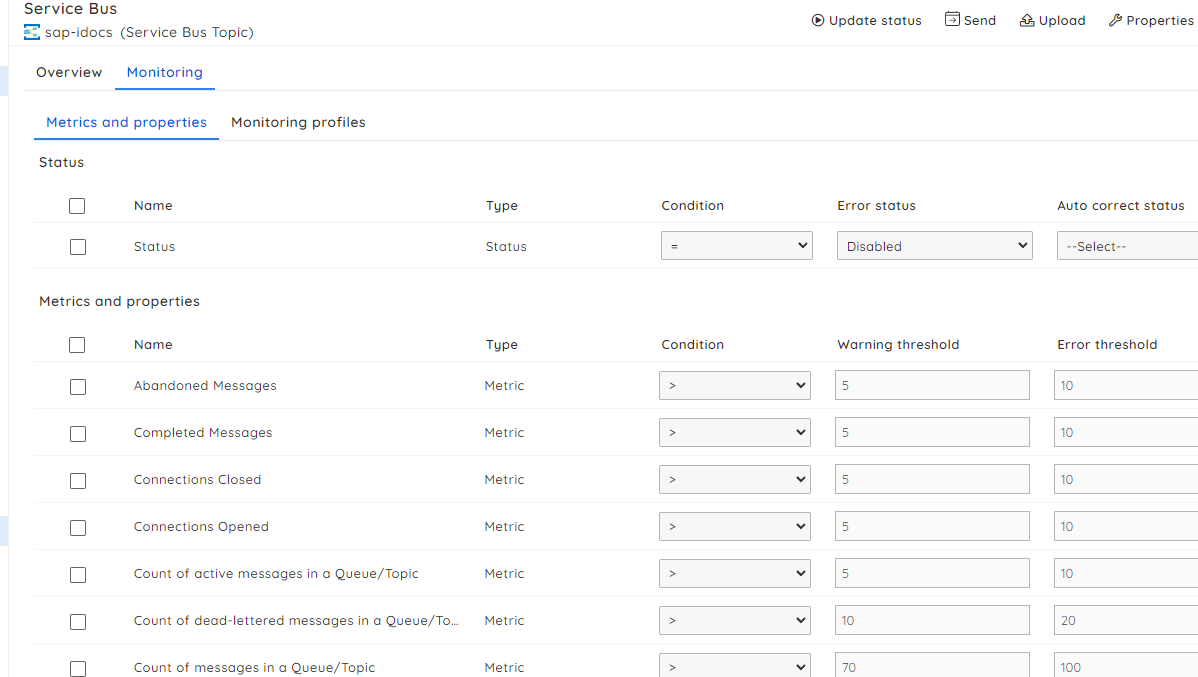
I can also configure the metrics I want to monitor or allow the profile to take care of that for me.
There are many other things you can do with service bus which you can learn more about on this page.
https://www.serverless360.com/azure-service-bus
Other
You can also have business apps if you want to manage your own common services. An example might be you have an app for managing the integration with a specific application.
Remember than an Azure resource can belong in multiple business applications so you could put all Logic Apps which integrate with Dataverse in one node to manage your Dataverse integration but also add those logic apps in business applications which focus on their specific business domains.
Was this article helpful?