Databricks
- 12 Feb 2024
- 5 Minutes to read
- Print
- DarkLight
- PDF
Databricks
- Updated on 12 Feb 2024
- 5 Minutes to read
- Print
- DarkLight
- PDF
Article Summary
Share feedback
Thanks for sharing your feedback!
Introduction
Azure Databricks is an analytics platform for big data and artificial intelligence (AI) that is quick, simple, and collaborative and runs on Apache Spark.
Turbo360's Business Application facilitates the management and monitoring of the following Databricks components:
- Databrick Compute Clusters
- Databrick Compute Pools
- Databrick Workflow Delta Live Tables
- Databrick Workflow Jobs
Pre-requisites
The following steps must be perfomed to grant permissions for the integration of Databricks services with Turbo360:
- Launch Databricks Workspace and go to Profile -> Admin Settings.
- Select Identify and access under Workspace admin settings and click on Manage next to Service principals.
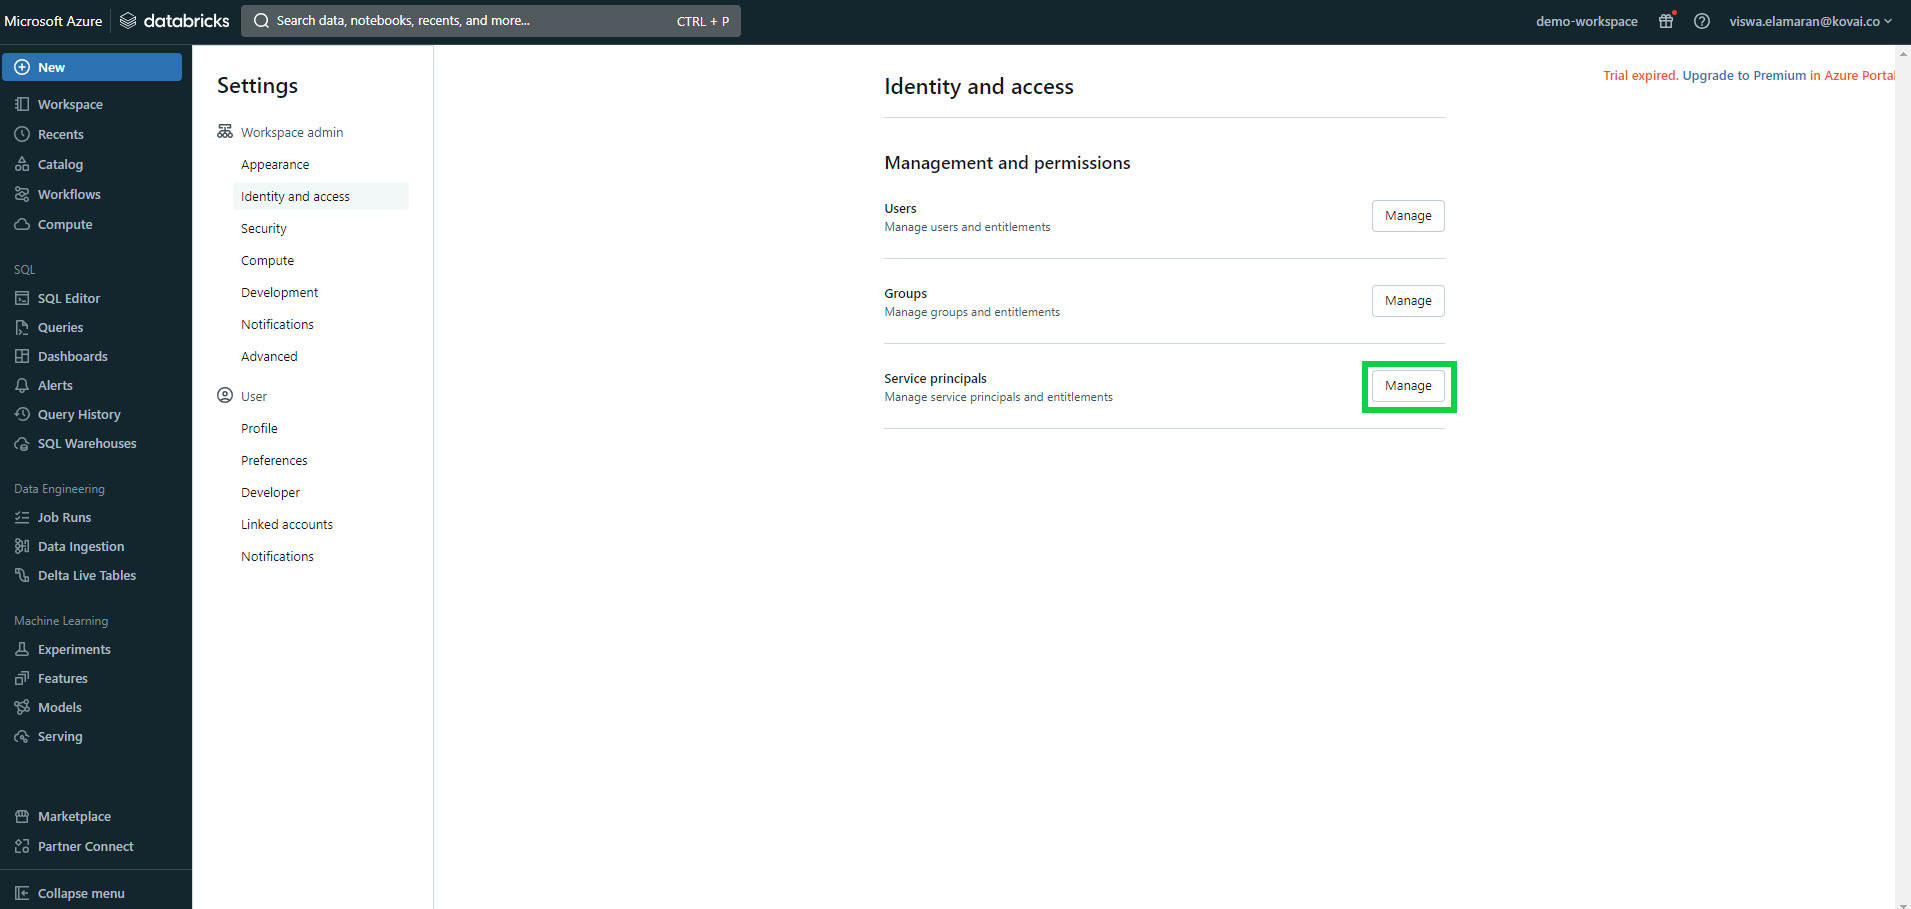
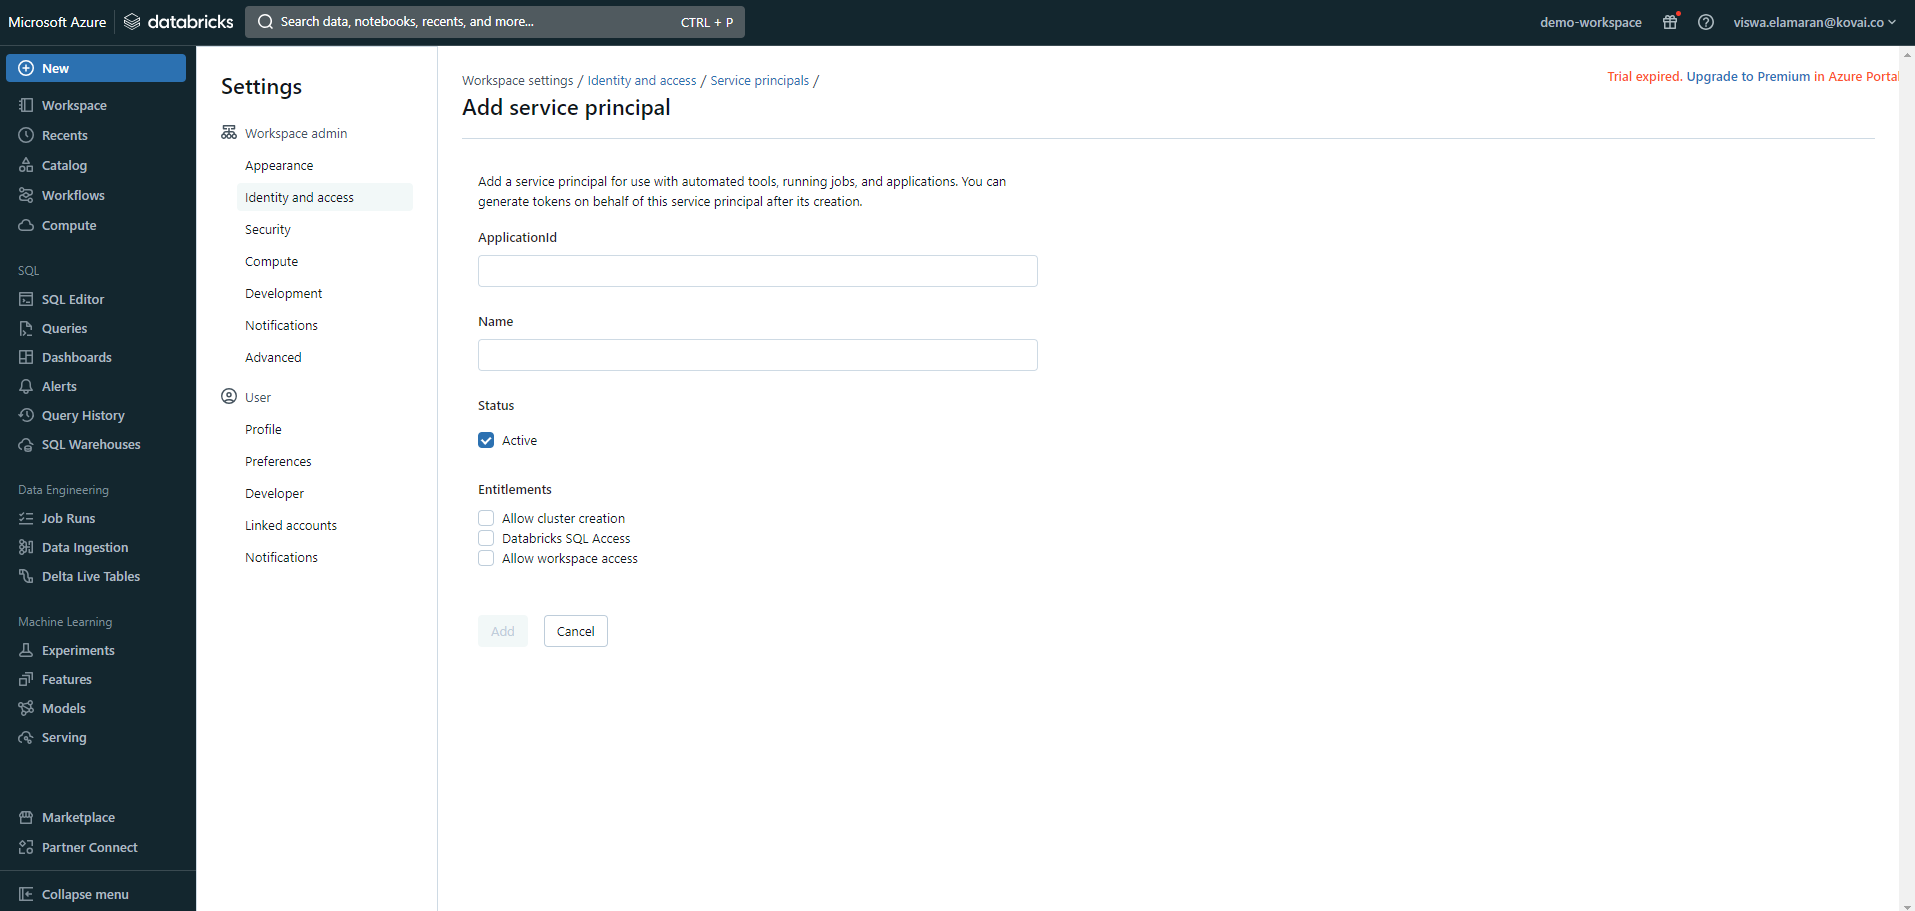
- Add the Service principal credentials that will be associated with Turbo360.
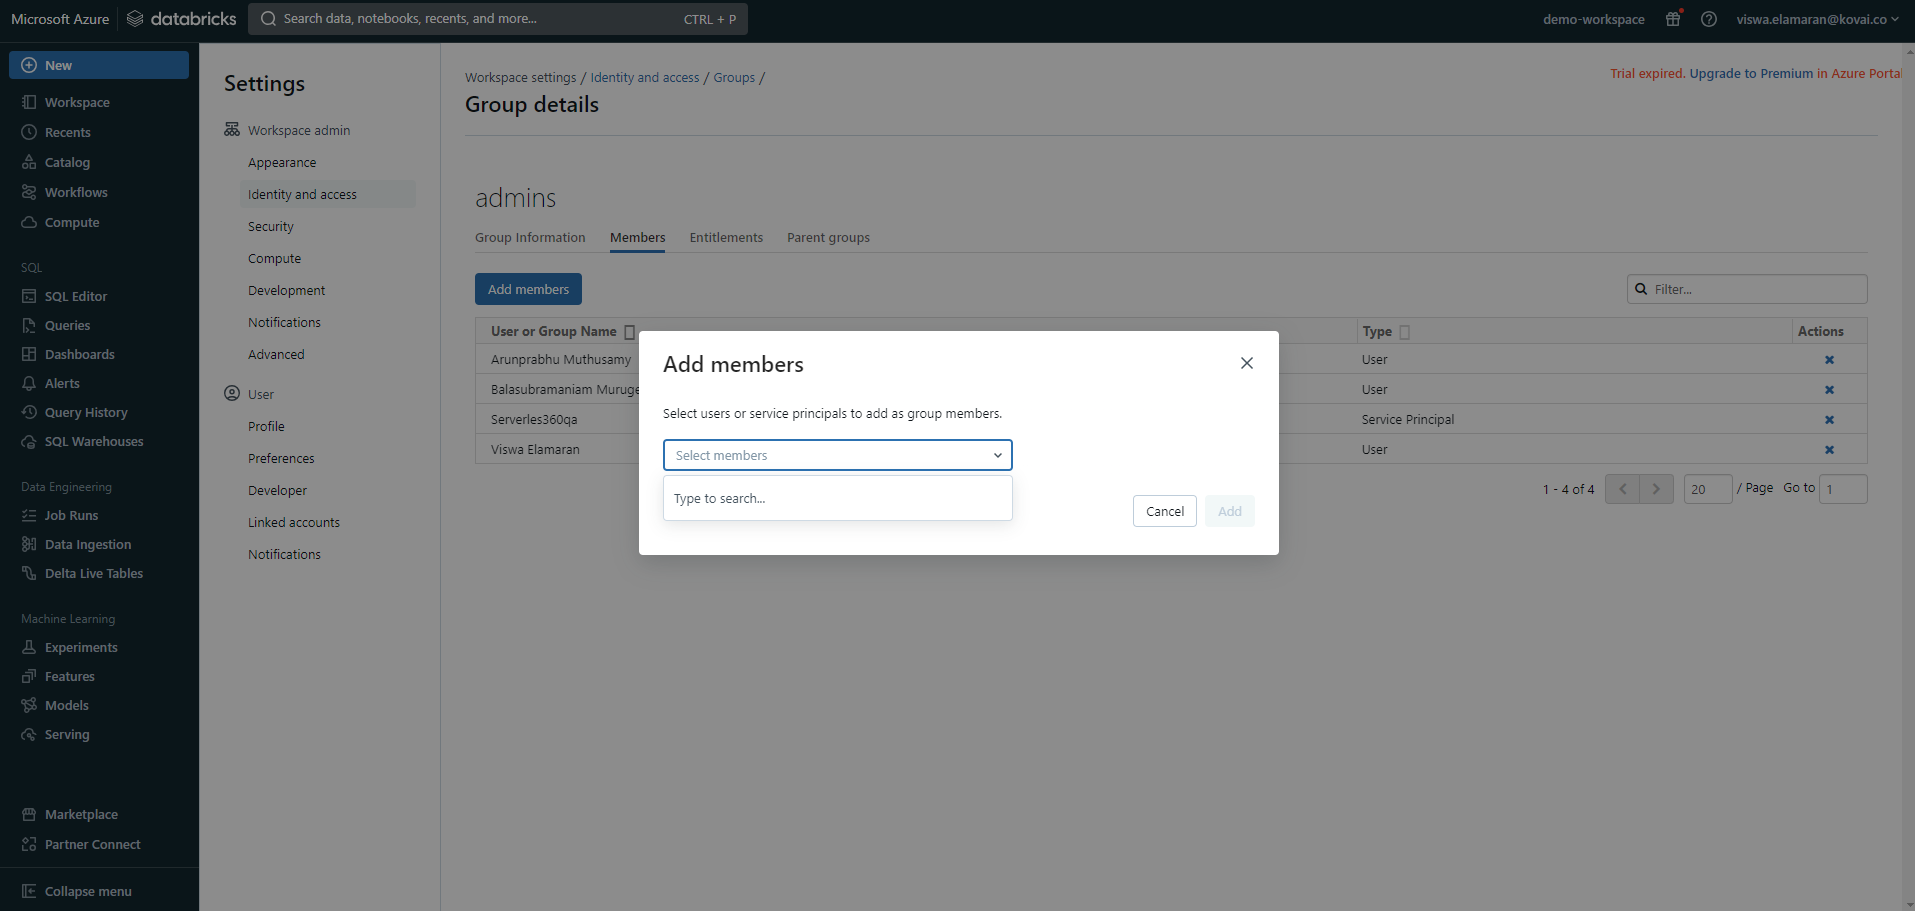
- Now, navigate to the following path: Identify and access -> Groups -> Manage -> admin.
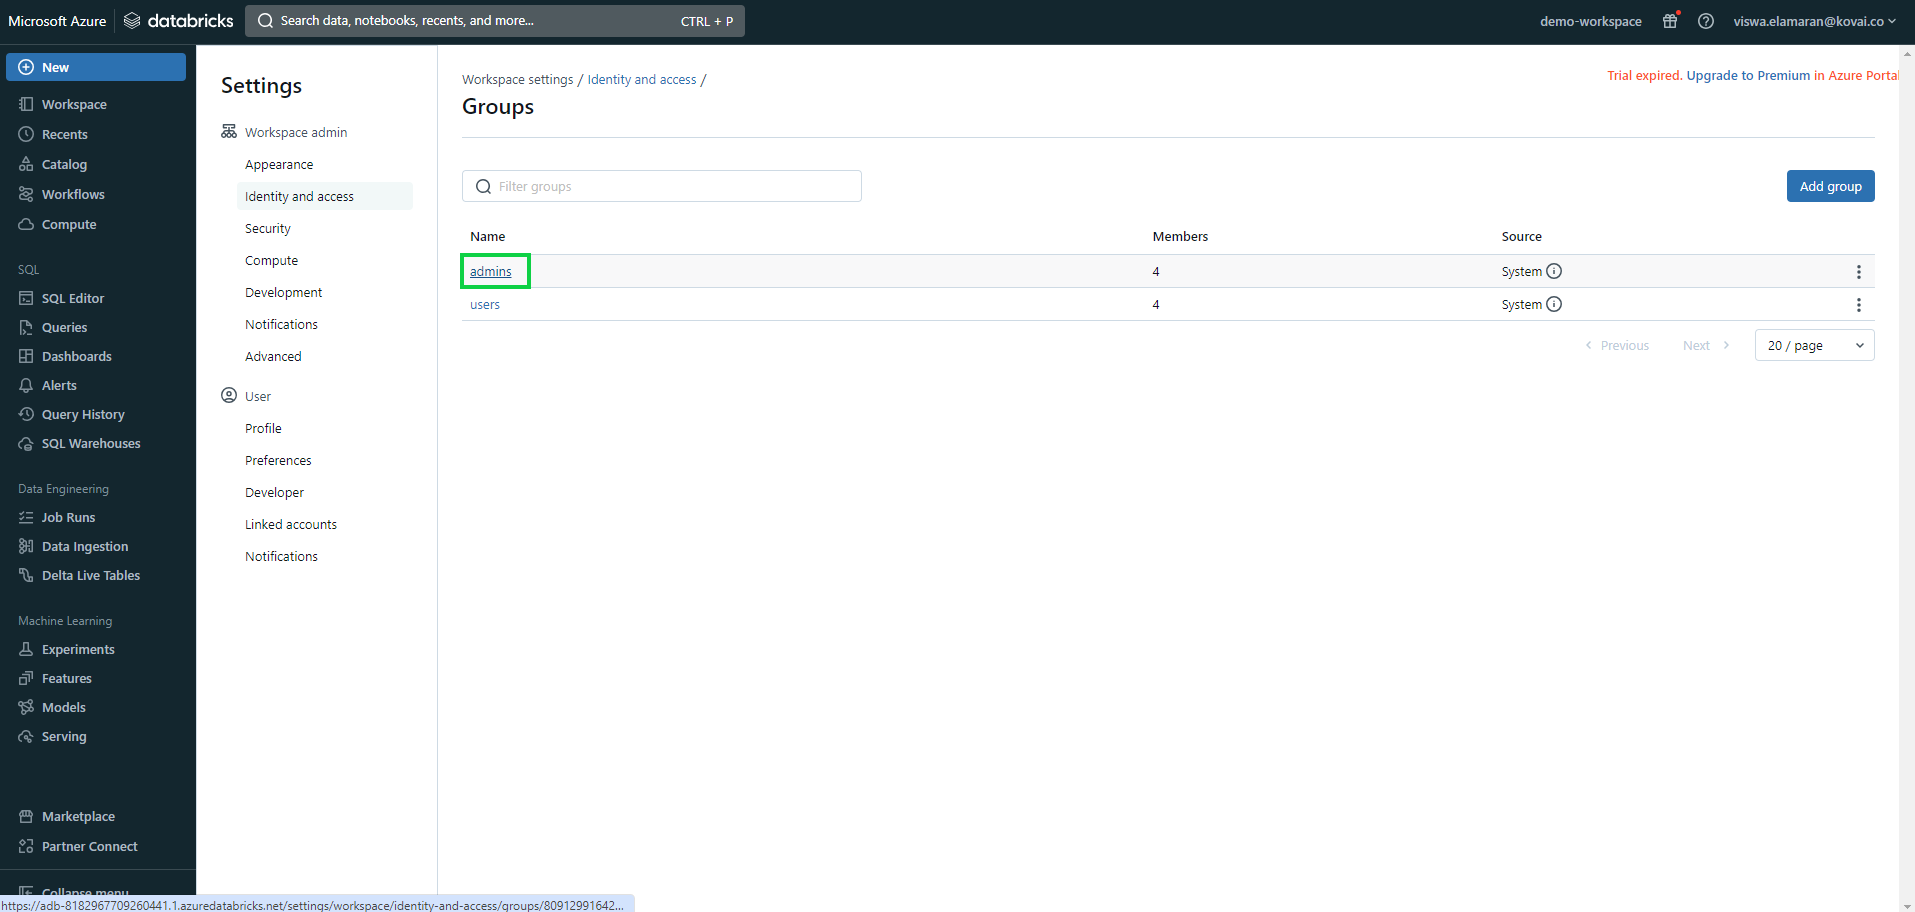
- Add the same Service principal as an admin group user.


Databrick Compute Cluster
Compute clusters are collections of computing resources used to carry out data analysis and processing operations defined in Databricks notebooks. These clusters are used by Databricks to divide and parallelize computations on big datasets.
Users can take full control over the functioning state of compute clusters using Turbo360 with the support to following operations:
- Start
- Stop
- Restart

Management operation
Utilize the management operation task within the Automated tasks section to schedule automatic changes to the state of a compute cluster.
Follow the steps below to set up a task that will update the cluster state when executed:
- Go to Automated tasks section in a Business Application that contains the Compute Cluster resource.
- Click New configuration -> Management operations.
- Choose Databricks Compute Cluster from the Resource type dropdown.
- Configure the desired resources and set the resource status.
- Schedule the task if necessary.
- Save the task.
State Monitoring
- Navigate to Databrick Compute Cluster -> Monitoring -> Rules.
- Configure threshold value for the state of the cluster to determine the health state.
- Click Save.
The user can specify an auto-correct status to automatically change the cluster state in the event of a violation.
The monitoring rule will be saved for Compute Cluster, and the monitoring state will be reflected after every monitoring cycle.

Databrick Compute Pool
Instances that are idle and available for use in specific Databrick Workflows are referred to as databrick compute pools.
State Monitoring
- Navigate to Databrick Compute Pool -> Monitoring -> Rules.
- Configure threshold value for the state of the compute pool to determine the health state.
- Click Save
The monitoring rule will be saved for Compute Pool, and the monitoring state will be reflected after every monitoring cycle.

Databrick Workflow Delta Live Tables
Delta Live Tables, a declarative framework, facilitates the creation of data processing pipelines characterized by dependability, testability, and maintainability. Task orchestration, cluster management, monitoring, data quality, and error handling are managed by Delta Live Tables, allowing users to focus on specifying the transformations they desire for their data.
The pipelines available within a delta live table can be managed using Turbo360.
Users can control the operational state of a pipeline within a delta live table by executing any of the following actions:
- Start
- Stop
- Restart

Management operation
The Management operation in Automated task configuration allows in scheduling a task to automatically update the state of pipelies within a Delta Live Table.
Follow the steps below to set up a task that will update the status of a pipeline within a delta live when executed:
- Go to Automated tasks section in a Business Application that contains the Delta Live Table resource.
- Click New configuration -> Management operations.
- Choose DataBrick Workflow Delta Live Table from the Resource type dropdown.
- Configure the desired pipelines and resource status.
- Schedule the task if necessary.
- Save the task.
The illustration given below depicts the management operation task setup for Databricks Workflow Delta Live Table:

State Monitoring
- Navigate to Databrick Delta Live Table -> Monitoring -> Rules.
- Configure threshold value for the state of the compute pool to determine the health state.
- Click Save
The monitoring rule will be saved for Delta Live Table, and the monitoring state will be reflected after every monitoring cycle.
Databrick Workflow Job
Databricks Workflows coordinate data processing, machine learning, and analytics pipelines on the Databricks Data Intelligence Platform. Workflows provide fully managed orchestration services seamlessly integrated with the Databricks platform.
This integration includes Databricks Jobs for executing non-interactive code within users' Databricks workspace and Delta Live Tables for constructing dependable and easily maintainable ETL pipelines.
Runs
Users have complete visibility over job executions under the Runs section, with advanced search option to filter out the runs based on the specified time interval.

Repair failed runs
All failed runs can be repaired with the help of Repair run option next to it. The user has the flexibility to specify the preferred key-value pair within the programming language category that aligns with the language defined in the corresponding Workbook.
Triggering a full refresh on the delta live table pipeline is possible while repairing the failed run.

- The repair history is accessible by clicking upon the relevant failed run identifier.

Cancel runs
Individual ongoing job runs or queued runs can be canceled, either one by one or collectively, using the respective buttons provided in the Runs section.

Run now
Workflow Jobs can be triggered directly from Turbo360 by using the Run now option available within the resource.
Users have the privilege to customize the job parameters with respect to the programming language defined in the corresponding Workbook.
The illustration given below shows how to trigger a new workflow job run easily from within the resource:

Monitoring

Failure Monitoring
- Navigate to Databrick Workflow Job -> Monitoring -> Rules.
- Select Failed Job Runs under Failures and configure the threshold values.
- Click Save.
Failure monitoring will be initiated once the rule is saved, and the monitoring state will be reflected after every monitoring cycle.
Duration Monitoring
- Navigate to Databrick Workflow Job -> Monitoring -> Rules.
- Select Job Run Duration under Duration and configure the threshold values.
- Click Save.
Duration monitoring will be initiated once the rule is saved, and the monitoring state will be reflected after every monitoring cycle.
Was this article helpful?